Predicting the Future- Linear Regression Intuition
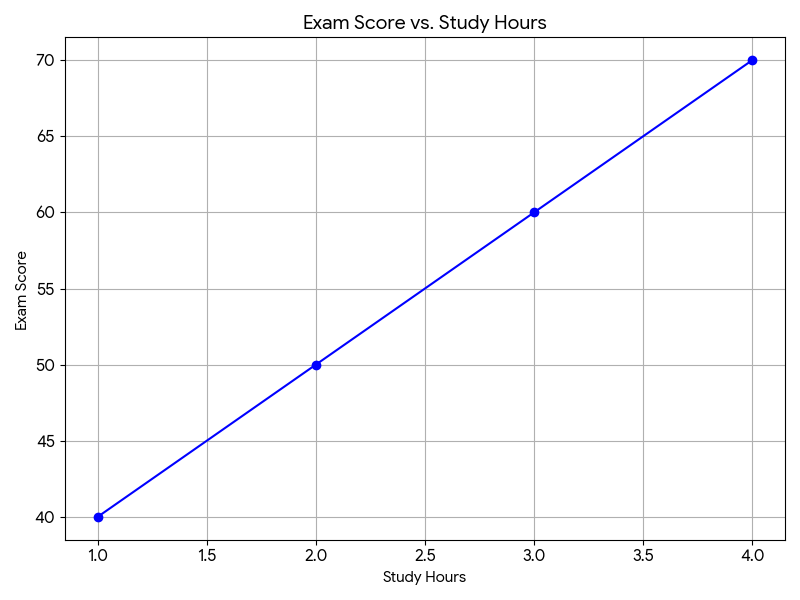
Imagine you have data about students’ study hours and their exam scores:
| Study Hours |
Exam Score |
| 1 |
40 |
| 2 |
50 |
| 3 |
60 |
| 4 |
70 |
Question: If a student studies for 5 hours, what score do you think they’ll get?
Try to guess the score by looking at the pattern in the table.
Spotting the Pattern
- Look at the numbers. the score seems to increase as study hours increase.
- You can draw a rough line through these points:
- Formula for the line would be:
y = mx + c Where:y = predicted exam scorex = study hoursm = slope of the line (how much the score increases per additional hour of study)c = y-intercept (score when study hours = 0)
- This line is your “prediction line”, it shows the trend of the data.
- Linear regression is the process of finding the best line that predicts new values accurately.
Key Takeaway
- You’ve just done linear regression in your head!
- Machine learning will teach computers to do this automatically for much bigger datasets.
- For now, focus on understanding the pattern visually.